
|
Edwards |
Tweets by @slimsuite
UPGMA Worked Example
The tabs below include a walkthrough of clustering 7 biological sequences (A-G) using the Unweighted Pair-Group Method with Arithmetic mean (UPGMA) method. Note that UPGMA is actually a generic method and thus the walkthrough could apply to any objects A-G for which pairwise distances can be calculated. A small CGI site for generating a UPGMA tree from a distance matrix can be found here.
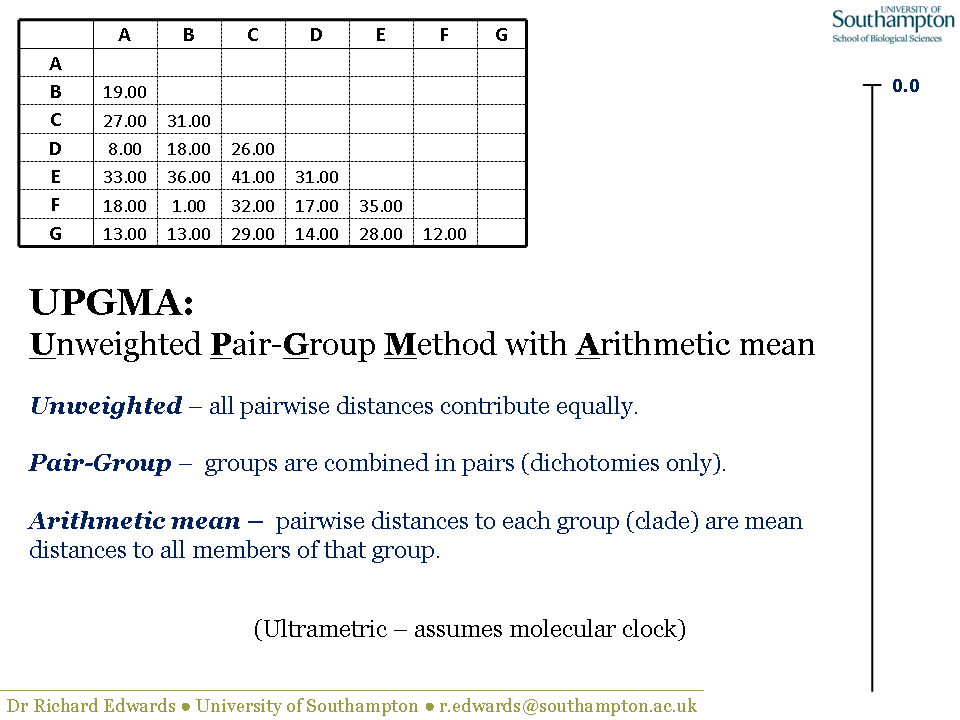
UPGMA is a distance method and therefore needs a distance matrix. UPGMA is "ultrametric", meaning that all the terminal nodes (i.e. the sequences/taxa) are equally distance from the root. In molecular terms, this means that UPGMA assumes a molecular clock, i.e. all lineages are evolving at a constant rate. In practical terms, this means that you can construct a distance scale bar and all the terminal nodes will be level at position 0.0, representing the present. In this example, the scale bar is shown on the right-hand side.
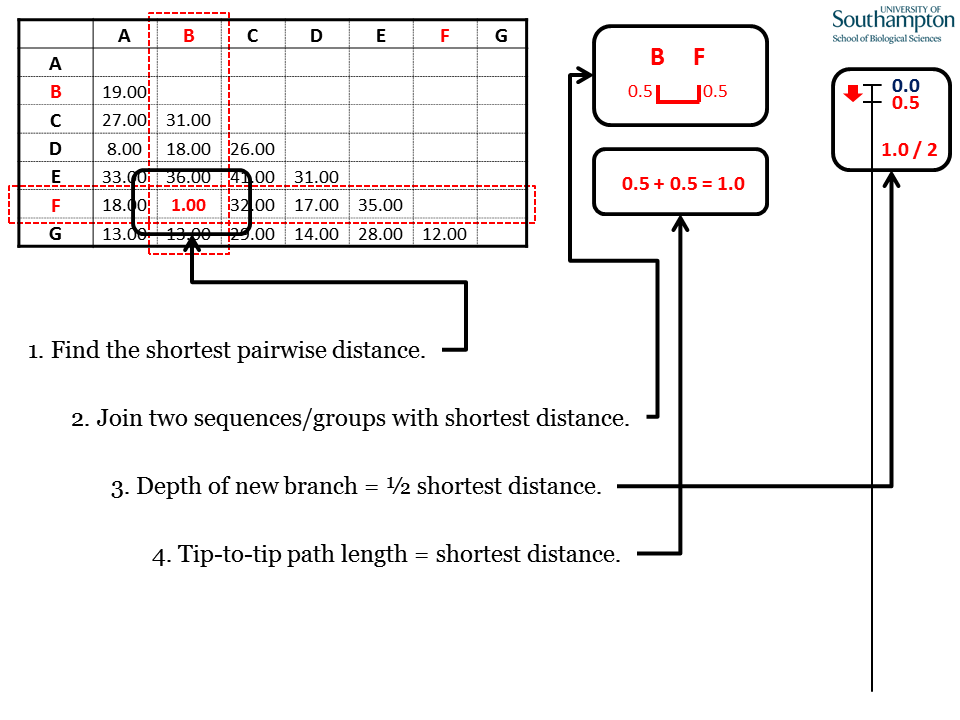
Each round of UPGMA follows the same pattern. (1) Identify the shortest pairwise distance in the matrix. This identifies the two sequences to be clustered. (2) Join the two sequences identified. (3) The pair should be linked at a depth that is half of the shortest pairwise distance. (4) The tip-to-tip distance between the joined elements will equal the shortest distance.
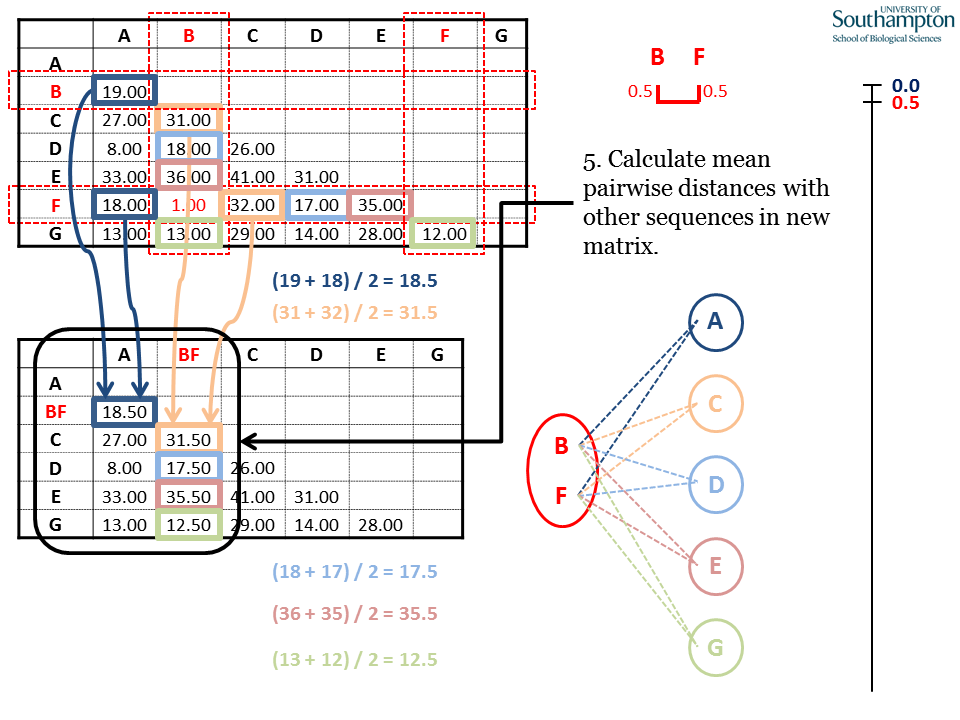
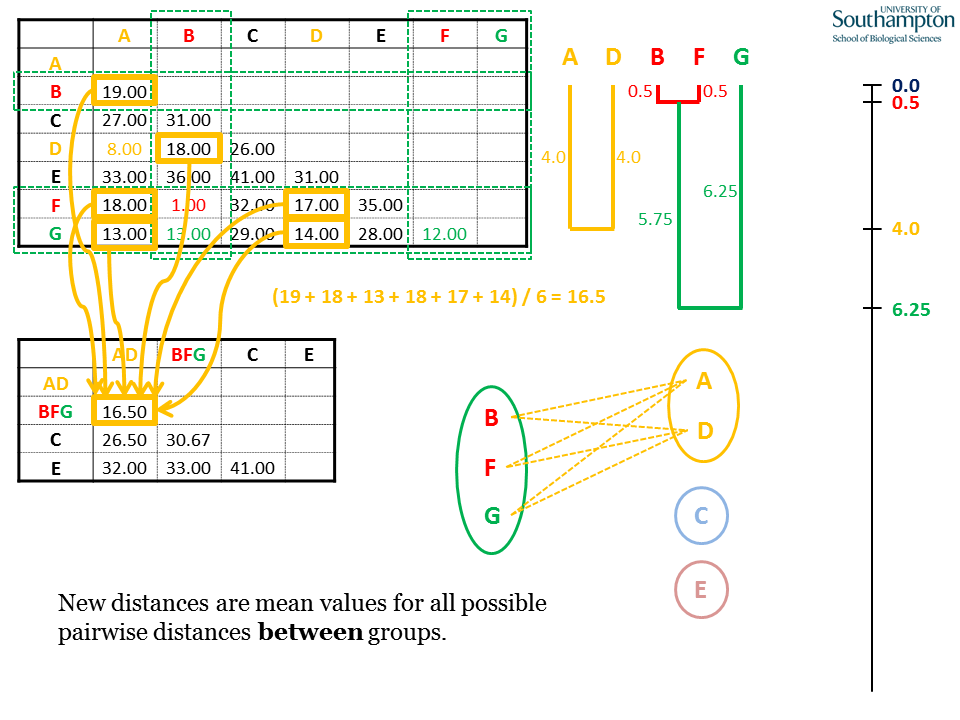
The two sequences joined (B and F) are removed from the original matrix and replaced by the new clade (BF). Each distance between BF and the other sequences (A, C, D, E and G) is the mean distance between them and B and F from the original matrix. E.g. d(A,BF) = (d(A,B) + d(A,F))/2.
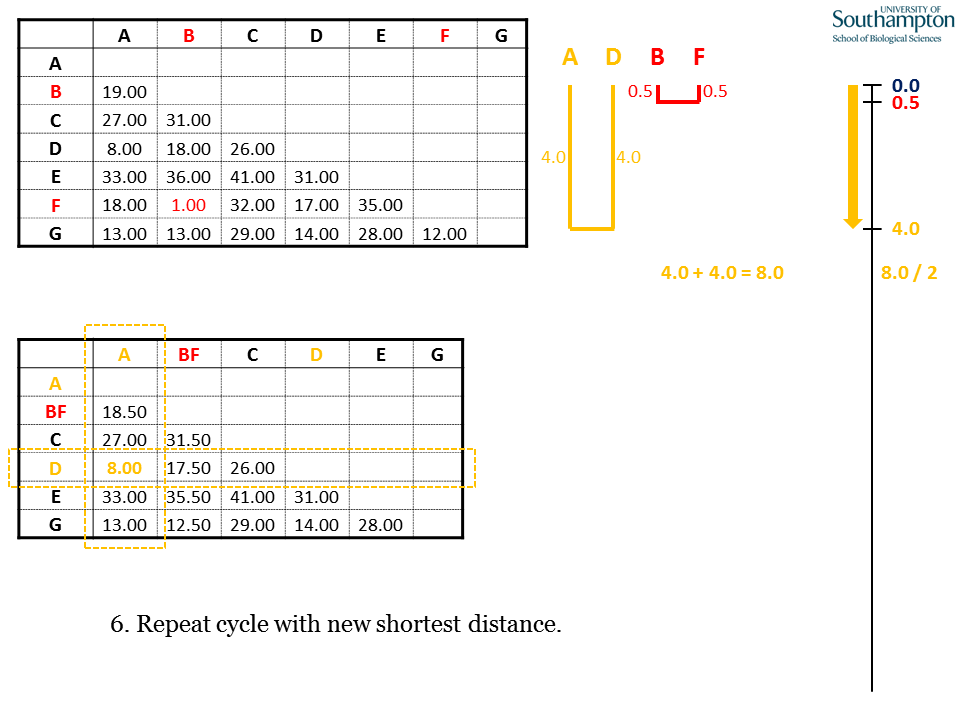
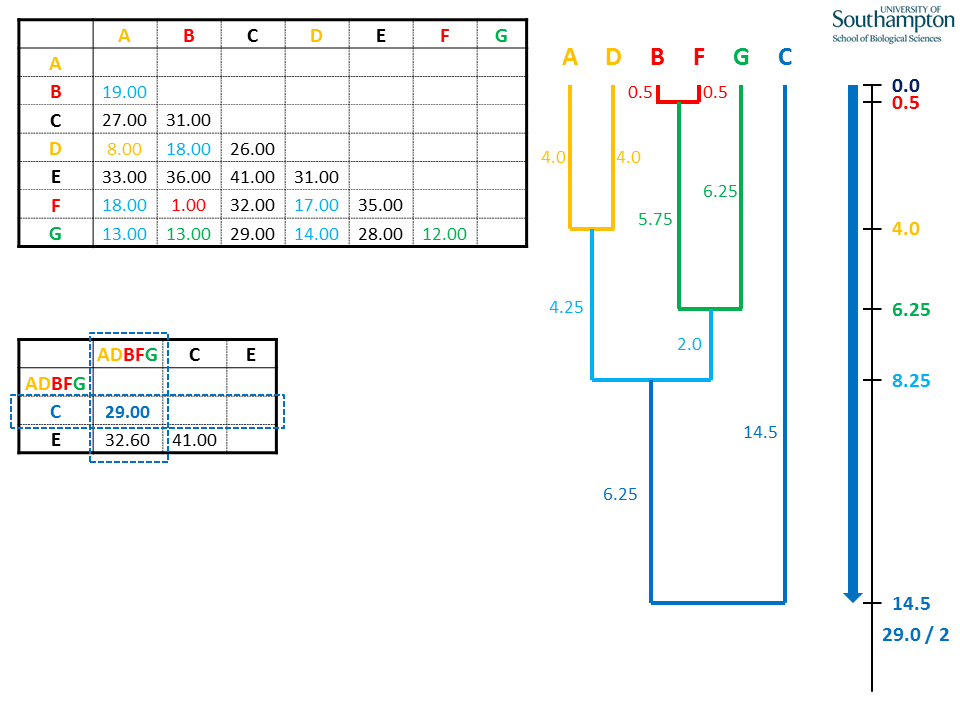
Identify the shortest pairwise distance in the new matrix. As before, join the two items at a depth equal to half the pairwise distance.
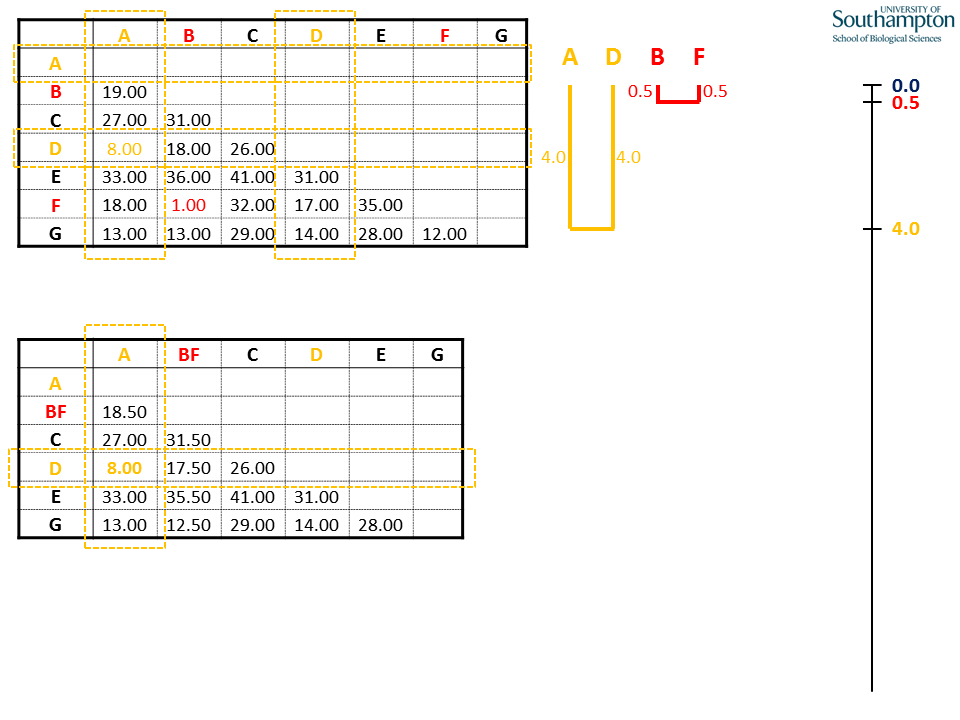
Each time the new matrix is made, distance are taken from the original matrix (top). All of the values to be replaced in the new matrix will come from the rows and columns corresponding to the sequences in the new clade (A and D), highlighted by the dashed orange boxes.
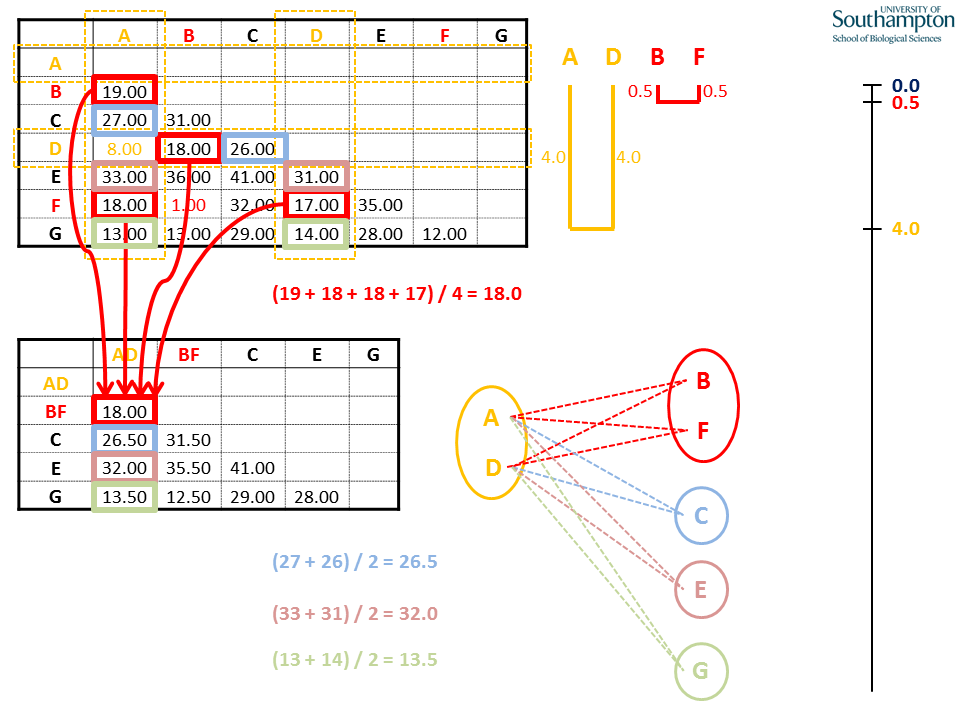
As before, mean values are calculated using the individual pairwise values from the original matrix. Where the new cluster (AD) is being compared to the previous cluster (BF), all pairwise combinations between the groups are used for the calculation, e.g.d(AD,BF) = (d(A,B) + d(A,F) + d(D,B) + d(D,F)) / 4.
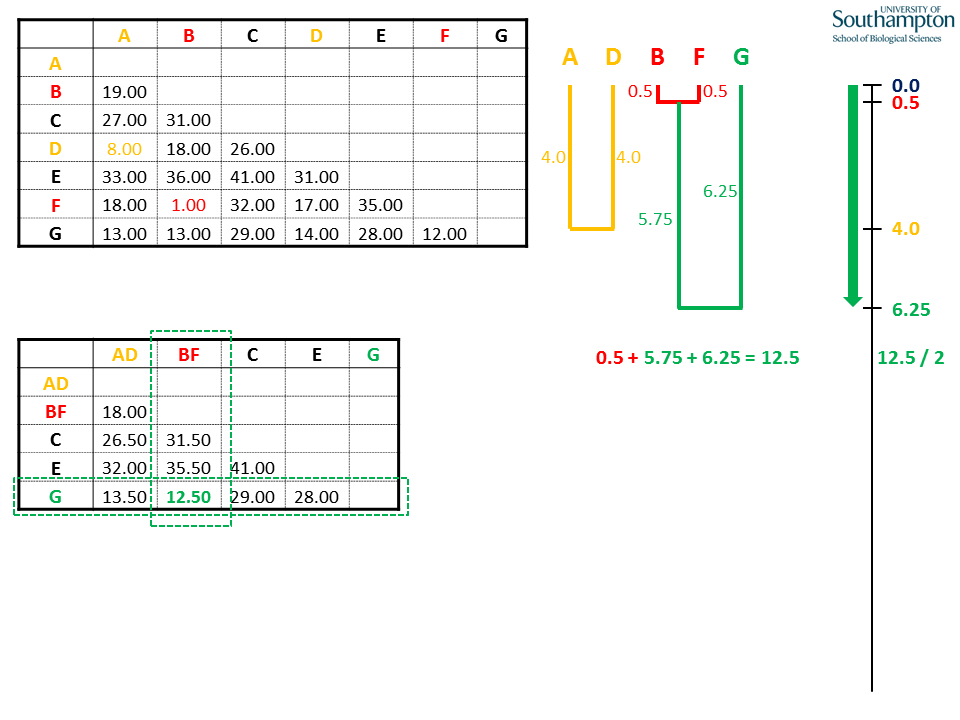
Again, the shortest pairwise distance in the new matrix is used to identify the groups/sequences to be clustered. In this case, sequence G is added to the BF clade. Again, the depth of the join is half the pairwise distance. The tip-to-tip paths from B or F to G equals the full distance.
Again, when generating the new matrix, use the pairwise distances from the original matrix. UPGMA is unweighted, so all pairwise distances contribute equally. This means that the distance between BFG and AD is the mean of all six possible pairwise combinations.
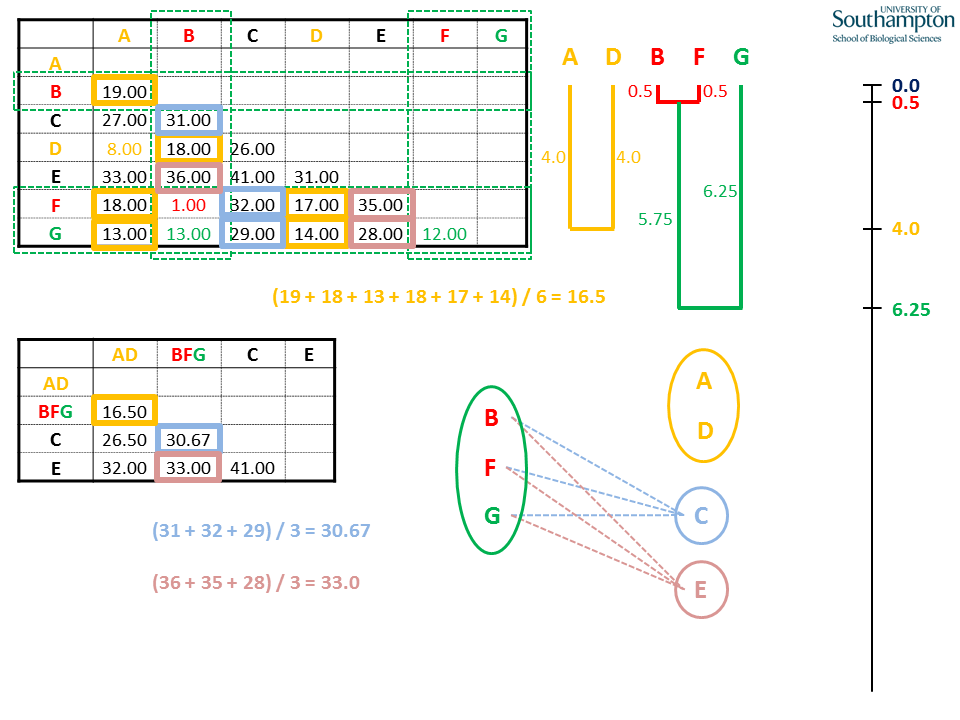
The rest of the new BFG columns and rows are calculated as the mean distances of B, F and G with the remaining sequences C and E. Note that all the pairwise distances in the rows and columns for B, F and G are either used for calculating the new means (coloured boxes) or are internal distances within the BFG clade (red and green text).
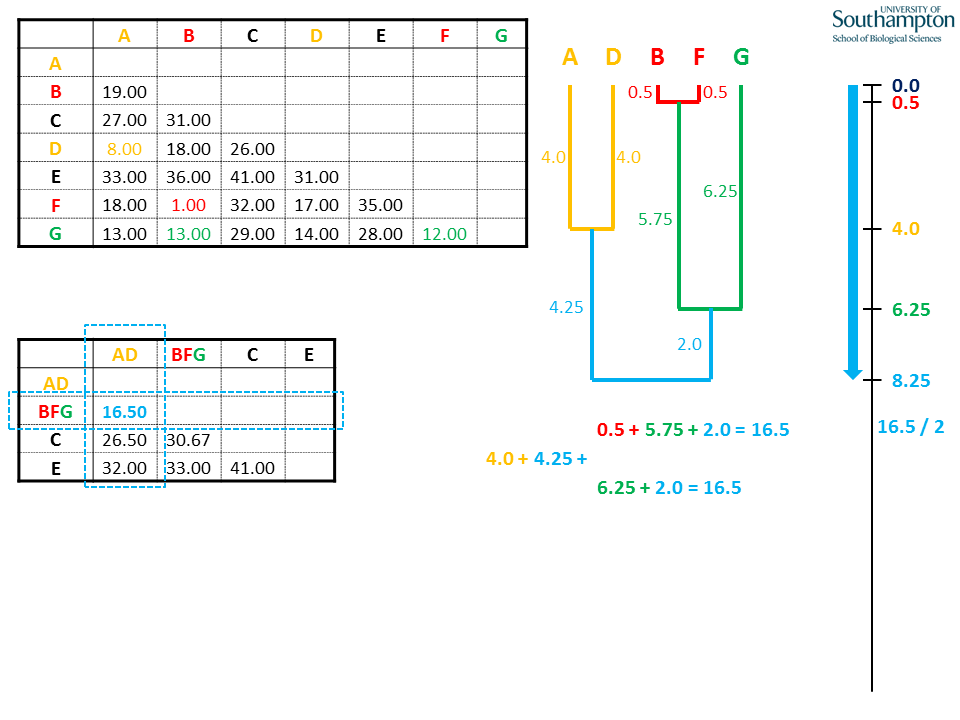
The cycle is repeated as before. This time, no new sequences are added but the two existing clades (AD and BFG) are joined at a depth of half the mean pairwise distance between AD and BFG. All possible tip-to-tip distances between A/D and B/F/G add up to the full distance.
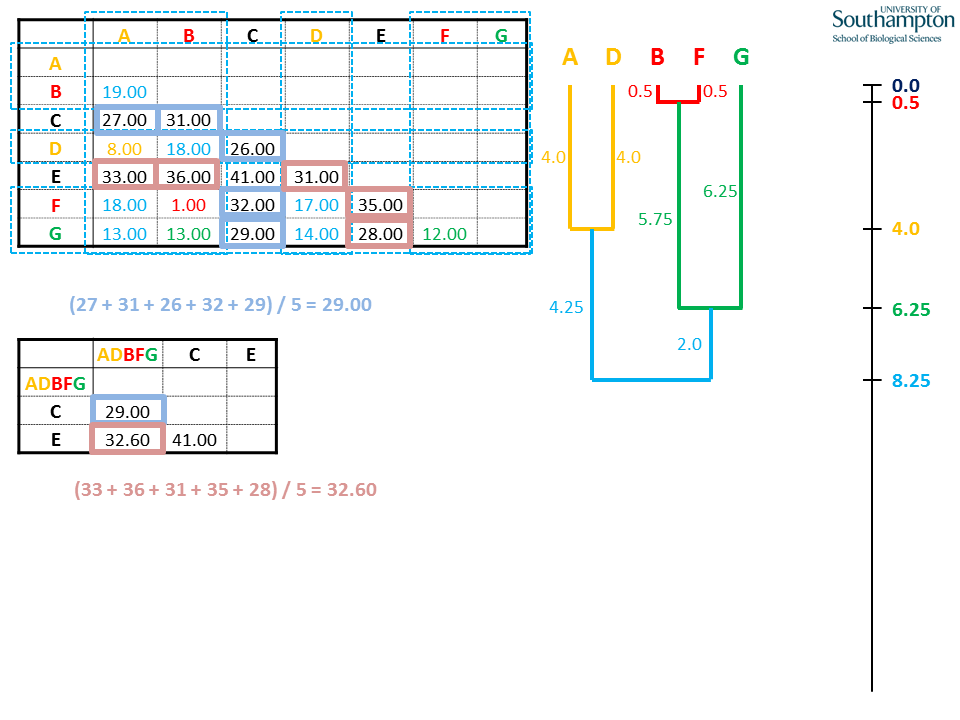
Again, the distance matrix shrinks by one and mean distances are calculated for the new clade, ADBFG.
Make penultimate join using shortest pairwise distance in new matrix, as previously.
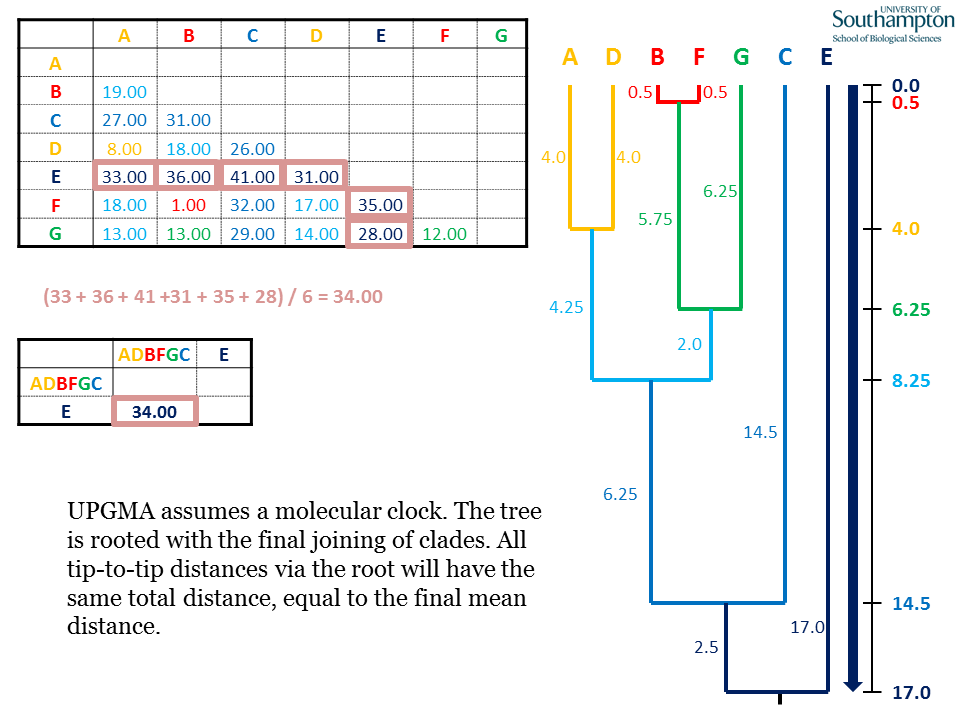
Once the final join has been made, the UPGMA tree is complete. UPGMA is inherently rooted and thus the root is placed at the deepest point of the tree, at a depth of half the final mean pairwise distance. All root to tip distances are the same, meaning that this method assumes a molecular clock for sequence data, i.e. a constant rate of evolution throughout the tree. In more general terms (e.g. for non-molecular data), such a tree is referred to as "ultrametric".
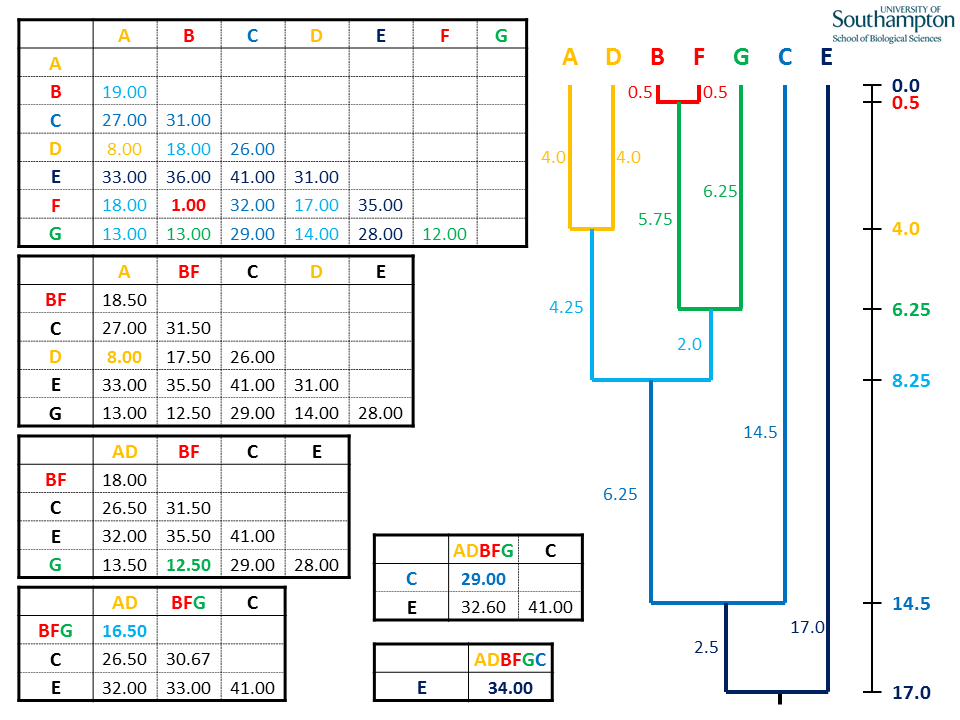
Once the UPGMA method is finished, all the pairwise distances in the original matrix will have contributed to one and only one of the shortest distances used in the clustering. These are colour coded in the example. E.g. the two green pairwise distances (d(B,G) and d(F,G)) generated the distance 12.50 used in the third cycle to join BF and G.
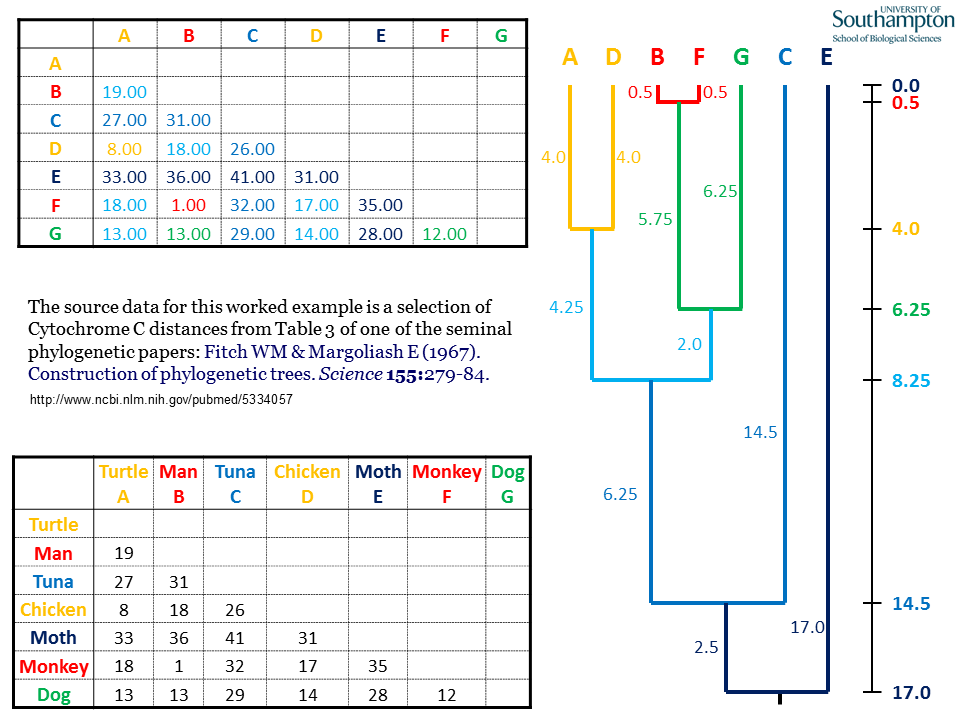
For clarity, this data represents only a subset of the taxa included in the original Fitch & Margoliash paper.
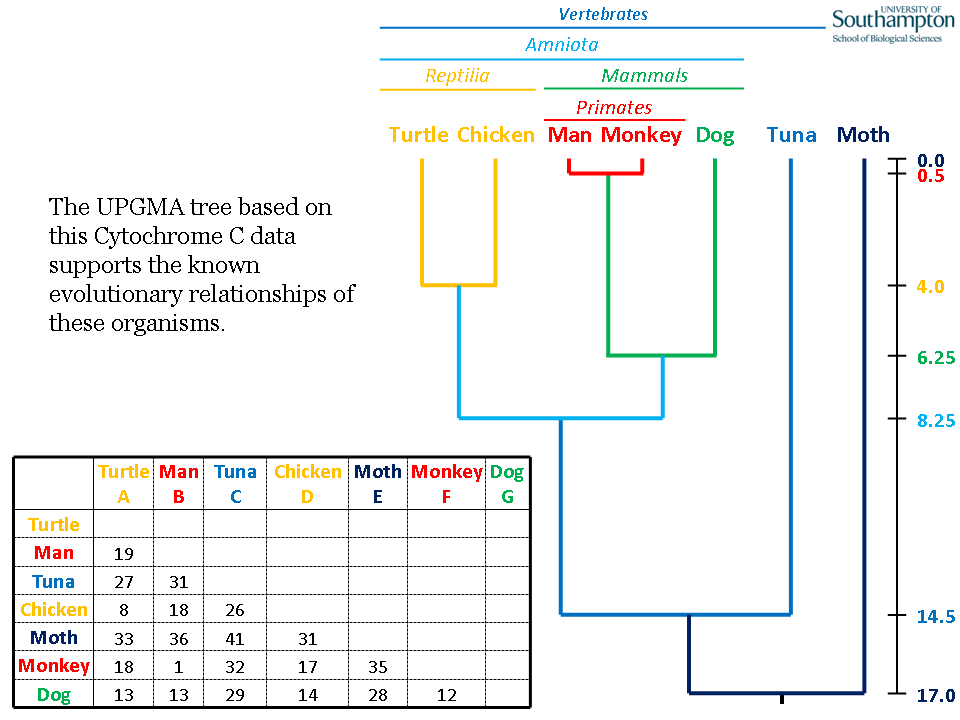
In this example, therefore, human (B) and monkey (F) are the closest pair, which next group with dog (G) (the other mammal), then the chicken (D)/turtle (A) (the other Amniota), then tuna (fish) (C) to form a vertebrate clade and finally moth (insect) (E). Based on this data, Cytochrome C supports the known phylogenetic relationship of these organisms. In the original paper, they get the same relationship for these organisms (and more!) using a different method.
Animated PowerPoint version available upon request. If you have any questions, please contact Dr Richard Edwards. This page and accompanying resources are under continual revision and development. Please report any obvious glitches/errors.
© 2016 RJ Edwards. Contact: richard.edwards@unsw.edu.au.